Let us now have a look at its complete feature set and how you can use it.
What is Power BI Desktop?
Power BI Desktop is free software that allows you to transform and visualize your dataset. It also enables you to connect to multiple sources of data and then merge them into a data model. You can then analyze and visualize the generated data models. So, it is basically a data modeling software using which users can perform analysis on their datasets. The people working on Business Intelligence assignments and projects can use Microsoft Power BI Desktop to create, analyze, publish, and share data reports. See: What is Data Mining? Basics and its Techniques.
What can you do with Power BI Desktop?
Here are some of the common uses of the Power BI Desktop application:
It lets you get data from multiple sources including Excel workbooks, Text, CSV, SQL Server, Web, OData feed, Dataverse, and more.You can create a data model using data transformation and cleaning tools.It also lets you use data visualization tools and generate charts and graphs to understand and analyze data visually.You can generate data analysis reports too.It enables you to share generated reports using the Power BI service.
Overall, it is well suitable for professionals including data analysts and business intelligence professionals. Even the aspiring ones can use it as it is easier to understand. See: Big Data Consumption. What are the Uses of Big Data.
What are the main features of Power BI Desktop?
Here are the main highlights and features of Power BI Desktop: It provides different views to visualize your data in multiple moded including Reports, Data (Tables, Measures, etc.), and Model. As we already mentioned above, it supports a wide number of file formats and data sources to import your data into it and then perform data analysis and visualization. Talking about it one of the key features which is the data modeling module, you get a dedicated tab for creating a data model called Modeling. In this tab, you can find various handy features and options including creating a new measure, generating a new column and calculating values for each row, creating a new table, managing relationships, creating a Q&A visual in a report, adding What-if parameters to your reports, and etc. You get a dedicated View tab in it from where, you can also change canvas theme, switch to mobile layout, apply filters, add a bookmark, synchronize slicers, etc. It also provides a dedicated Performance Analyzer feature that helps you monitor your reports to check the time taken by each visual to query data and render results. It lets you create several data visualization charts including stacked bar chart, stacked column chart, clustered bar chart, line chart, pie chart, area chart, waterfall chart, funnel, scatter chart, donut, treemap, map, gauge, multi-row card, R script visual, python visual, Q&A, and many more. It even lets you import custom visuals from a file or get more visuals from the Power BI online service. Apart from regular visuals, Power BI also contains four AI-powered visuals that include Q&A, Key influencer, Decomposition tree, and Smart narrative. It lets you export your reports to a PDF document. Or, you can also create a Power BI template for the same. Apart from that, you can publish your reports to the Power BI file (.pbix). Read: How to perform Regression Analysis in Windows?
How to download and use Power BI Desktop?
Here are the basic steps to download and use Power BI Desktop on Windows 11/10: The Microsoft Power BI Desktop is available on different platforms. You can get it on the official Microsoft Store or you can directly download its executable from the web. For the users who prefer installing apps from Microsoft Store, you can easily install Power BI from microsoft.com. Just go to the aforementioned link and press the Get button. The app will then open up in your Microsoft Store app. You can simply hit on the Get button and it will then be installed on your PC in some time. And, if you want to simply download the executable and install the software on your PC using the executable, you can visit the Microsoft Download Center page and download the application. After installing Power BI Desktop, launch the application and then you can start using it. The first step to using it would be connecting to your data. To do that, go to the Home tab and then click on the Get data button.
You will see different data sources to import your data. Simply click on the one from which you want to import your data and then provide the type of data you just selected. For example, if you select the Excel workbook, then you need to browse and select an Excel file. After connecting to or importing datasets, you can go ahead with transforming your data to clean your data. For that, go to the Home tab and click on the Transform data > Transform data option. It will open up the Power Query Editor window in which you can perform data transformation using a variety of tools.
It offers features like Transpose, Reverse rows, Change data type, Merge columns, Convert to list, Pivot Column, Format date and time values, etc. You can also perform statistical, maths, scientific, trigonometry, rounding, and information extraction operations. It also provides a dedicated feature to run custom R and Python scripts to transform and shape your data. Read: Fix Power BI Desktop login issues. You can also model your data by going to its Modeling tab where you can find handy features like creating new measures, tables, What-if parameters, and more.
When you have a data model ready the way you want, you can go ahead with generating visuals for it that will help you and others understand the data better. We have already talked about the kind of visuals and graphs it lets you create.
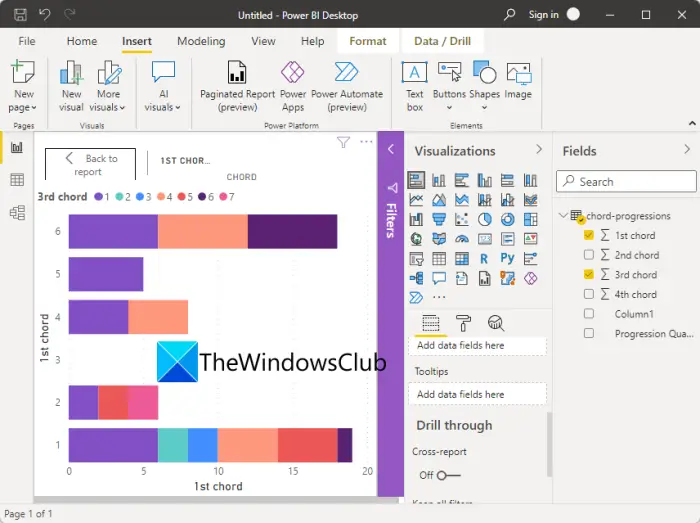
You can simply go to the Visualization pane present on the right and then select the kind of visual you want to create. After selecting the graph, drag and drop the columns to Axis, Values, Legend, Tooltip, and other fields to map data on the graph accordingly.
As you do that, you will be able to view the visuals on the report. If you want, export the visuals’ data, sort fields, and do more. Now, you can create a report which is basically a collection of all the visuals in one Power BI Desktop file.
Finally, you can publish and share the reports. To publish the report, click on the Publish button present in the Home tab. It will ask you to connect to the Power BI service using your Power BI account; just follow the instructions and you will be able to publish the report.
It also prompts you to select whether you want to share the report on a workspace, a team workspace, or somewhere else in the Power BI service. Do note that you need a Power BI license in order to share reports to the Power BI service. See: What is the R programming language and why you should use RStudio?
How do you use Power BI for beginners?
Power BI is pretty easy to understand even with advanced data analytics tools. Its GUI is not at all complex and all the tools are easily accessible. So, beginners can easily use it with the guide we have shared in this article. Read: How to share Excel Insights with Power BI Publisher for Excel.
Is Power BI Desktop the same as Power BI Pro?
Power BI Desktop is the free version of Power BI, while Power BI Pro is the full version of the software. Power BI Pro is a paid edition and you need to purchase an individual license to be able to use it. Like, if you have an organization of 15 people, you will have to purchase 15 individual licenses for each one of them to use the application. This edition obviously has more advanced features as compared to the free one, such as embedding Power BI visuals into apps, dashboards, unlimited viewing, native integration with Azure Data Services and other Microsoft services, and more. Hope this post helps you get insight into Power BI Desktop and how to use it. Now read: Best Free Statistical Analysis Software for Windows.